Performance Methodologies
Poor performance costs the software industry millions of dollars annually in lost revenue, decreased productivity, increased development, hardware costs and damaged customer relations.
Most applications tend to focus on correctness over performance. The shift towards performance only occurs once it is seen as a problem. When that happens, one rarely has time to dedicated towards improving it. This article aims to show you that there is no simple answer. A lot of performance work should be done in early phases of development. For the rest of the article, the reader is considered having a role of Performance Engineer or “acting” as one.
In my experience, a strictly “agile” methodology (Idea -> MVP -> Feature -> “Refactor”) tends to leave out proper performance engineering, since performance is not a goal but an expectation.
Performance is a field where the more you know, the less you understand.
Regardless of the source, when a performance issue appears it should be fixed immediately. Two ways are: 1) modifying code/architecture or throwing money at additional hardware resources. The second path in some time will lead to the same problem down the line.
Prior starting performance analysis, you must understand your application architecture. Any analysis requires clear boundaries and a full understanding of dependencies and third-party services.
A diagram of your software architecture is a great starting point.
The foundation of your software should be resilient to achieve better results.
Monitoring
Today, a big part of the market is adopting distributed systems. As we’ve come to learn, such systems adds a lot of complexity to your architecture in exchange for scalability and availability (resilience).
It also adds more components to your list of dependencies. Therefore, you should monitor these dependencies to have better visibility when things deviate from a happy path.
Each part of the architecture (or software) needs individual monitoring that helps us go back in time and answer some of these questions:
- When did the software start performing worse?
- During what timeframe are we seeing most activity?
- How are components behaving during these timeframes? Think: I/O latency, DNS resolution, CPU or RAM consumption
These questions will help to choose the right performance methodology to apply.
Known-Unknowns
This section is a reference to the book System Performance by the author Brendan Gregg.
In performance analysis we can split information into three types:
- Know-Knows: These are things you know, for instance, you know that you should be checking CPU utilization and you know that the value is 10% on average.
- Know-Unknows: There are things that you know that you do not know. You know that an increase in API response time can be related to a third-party component, but you don’t have metrics showing it.
- Unknown-Unknowns: These are things you are unaware of not knowing. Confusing? For instance: you may not know that DNS resolution can become heavy I/O latency, so you are not checking them (because you didn’t know).
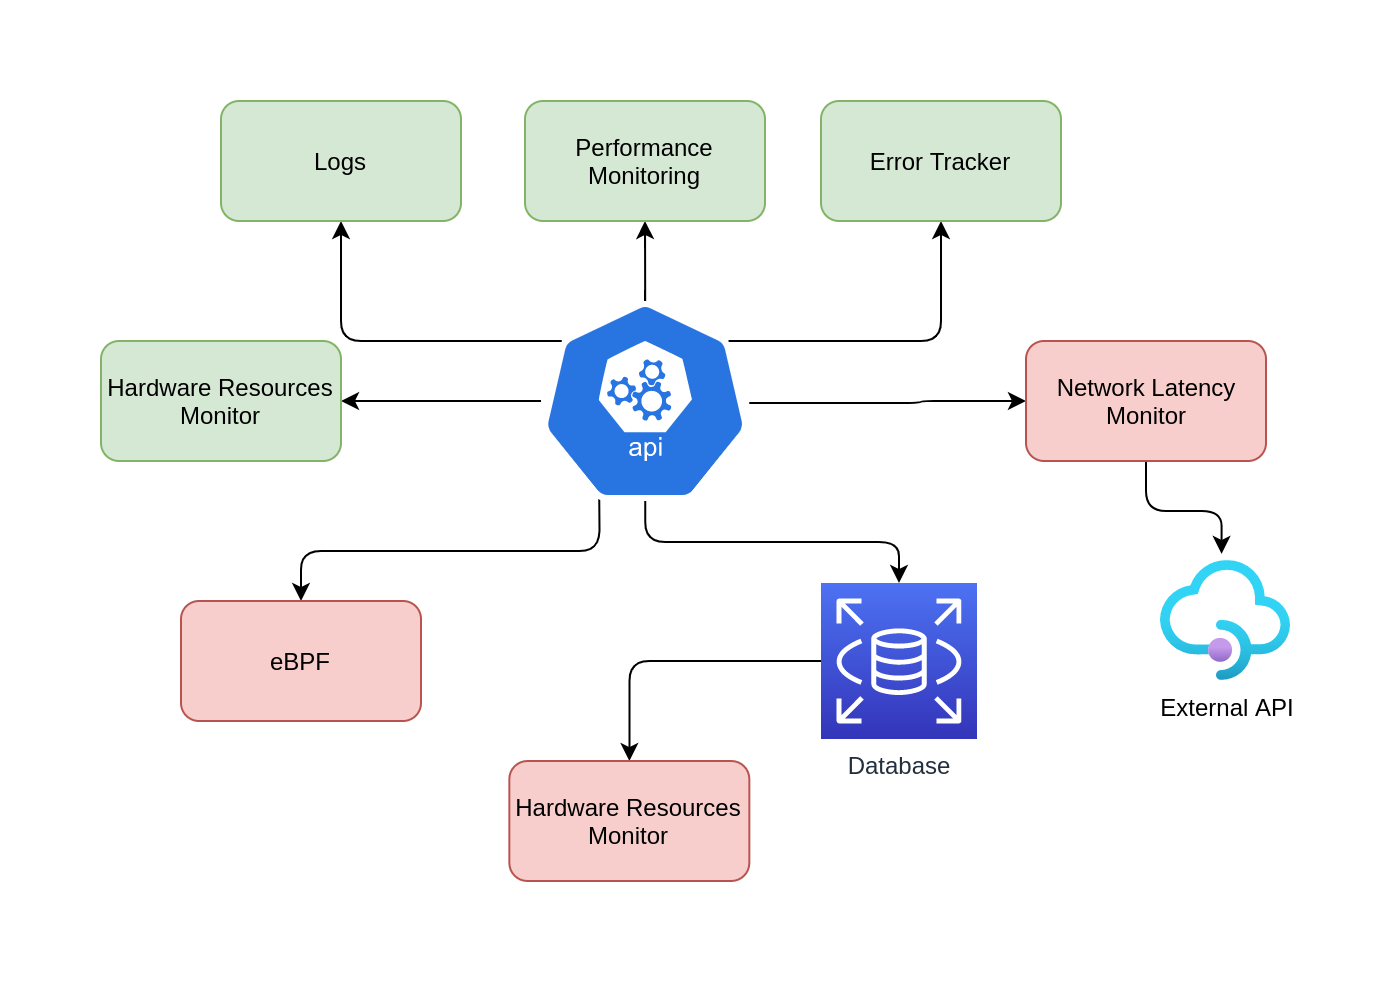
While creating architecture diagrams, unknowns-unknowns obviously aren’t mappable since you don’t know about them.
unknown-unknowsare common. It is your job as a performance engineer to transform theunknown-unknownsintoknow-unknows.
The Diagram above map known-knowns (Green box) and known-unknows (Red box)
Observability Tools
As previously mentioned, achieving observability in our software/architecture is fundamental to perform performance improvements. In this section, I’ll walk through a few tools that are great for this purpose.
Tracing
Tracing collects per-event data for analysis. Normally, tracing tools are not enabled by default since it adds CPU overhead to capture and send/store the data.
Logging (including system logs) can be seen as low-frequency tracing that is enabled by default.
Some common tools:
system-wide:
-
tcpdump: network packet tracing -
perf: Linux Performance Events (tracing static and dynamic probes)
per-process:
-
strace: system call tracing -
USDT(Userland Statically Defined Tracing) -
DTrace: observability framework that includes a programming language and a tool.
TracePoints is a great way to observe your software in the production environment. You can use USDT (dynamic probes) or static tracepoints. For further information check the useful links section.
Profiling
Profiling characterizes the target by collecting a set of samples of snapshots. CPU usage is a common example where samples are taken of the stack trace to characterize the code paths that are consuming CPU cycles.
Note: For further information about Profiling CPU, I’ve made a blog post doing CPU Profiling in a Node.js application. Check here.
Tools:
-
perf: Linux Performance Events (profiling) -
cachegrind: a Valgrind sub tool, can profile hardware cache usage and be visualized usingkcachegrind
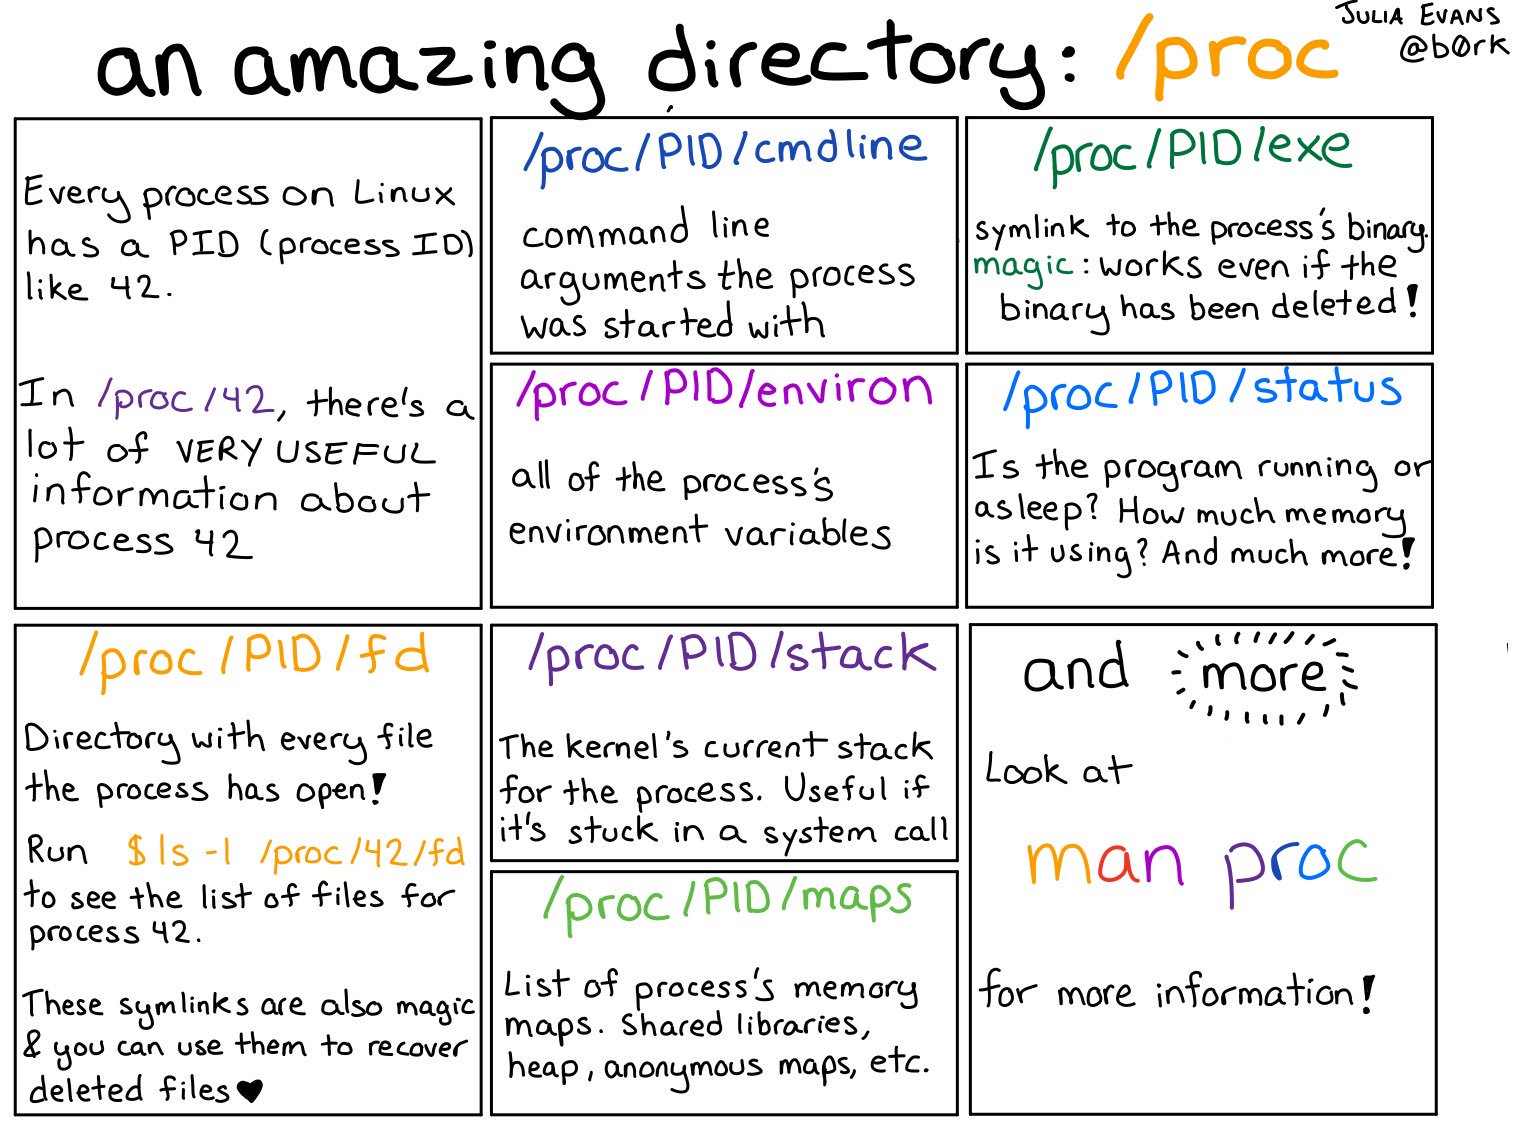
/procis a file system interface for kernel statistics, it contains directories where each directory is named after the PID of the process. These directories contain a number of files containing information and statistics about each process mapped from kernel data structures.
 -
- Methodologies
This section will describe three of the most used methodologies (by me at least). Apply a methodology when performance issues start showing up; there is no rule about choosing the best approach. Previous experience with your software architecture will likely be the best way to make a decision.
USE
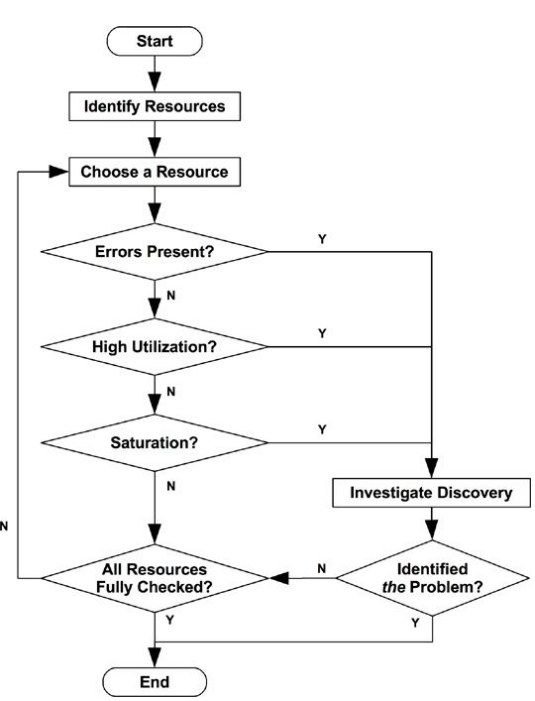
Utilization, Saturation and Errors (USE) is an methodology that should be used early in performance investigation. For every resource, check the utilization, saturation, and errors:
- Resource: server components (CPU, buses, …)
- Utilization: for a set time interval, the percentage of time that the resource was busy servicing work. While busy, the resource may still be able to accept more work.
- Saturation: additional work to be done, likely waiting in a queue. Jobs that cannot be dealt with instantly.
Its important to consider that it can be counter-intuitive; a short burst of high utilization can introduce saturation and performance issues even though the overall utilization is low over a long interval. CPU utilization can change dramatically from second to second so a 5-minute average may disguise short periods of 100% utilization and therefore lead to saturation.
Note: The saturation could not be easier to identify.
The first step is to create a list of resources:
- CPUs: sockets, cores, hardware threads (virtual CPUs)
- Main memory: DRAM
- Network interfaces: Ethernet ports
- Storage devices: disks
- Controllers: storage, network
- Interconnects: CPU, memory, I/O
Virtual resources are fundamentally different than dedicated hardware. Especially as your resources are both shared and intentionally throttled. Some - if not all - cloud providers make their money by overselling and betting on idle processes.
The USE method is most effective for resources that suffer performance degradation under high utilization or saturation, leading to bottlenecks. Fortunately, they are not common system bottlenecks, as they are typically designed to provide an excess of throughput. Unfortunately, if they are the problem, can be difficult to solve.
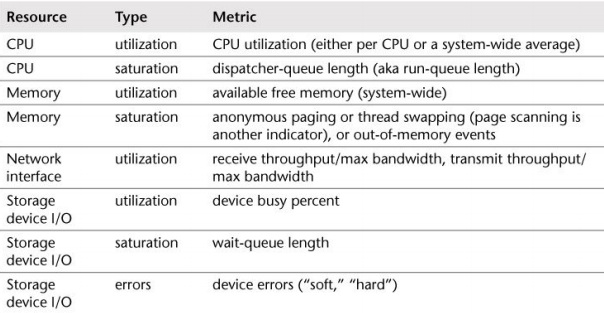
After you get the list of resources, try to create some metrics for it:
The process of elimination is good for us. Eliminate a possible resource bottleneck may help us to focus on another resource limiting our scope.
Drill Down
The process iterates through deeper layers of the software stack – even to hardware if necessary – to find the root cause of the issue. I try to to apply this methodology in every part of the software stack. It’s usually harder to do so without having the bigger picture; but as you get more experienced you start recognizing recurring issues.
Collecting and monitoring metrics is fundamental. Without it, we cannot fix the bugs the components cause.
Such deeper analysis may involve the creation of custom tools and inspection of source code (if available). Here is where most of the drilling takes place, peeling away layers of the software stack as necessary to find the root cause.
Imagine an application that after a month in an production environment has begun to perform poorly.
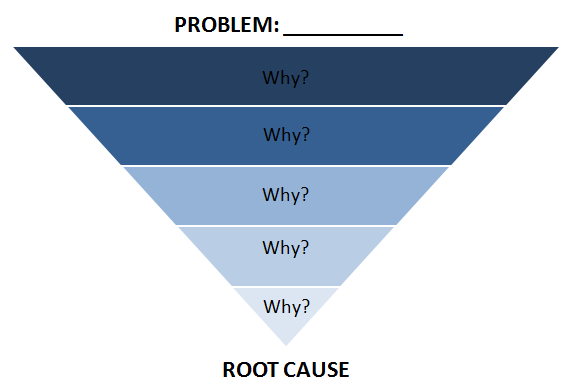
Five Whys
- A database has performing poorly for some queries. Why?
- It’s delayed by disk I/O due to memory paging. Why?
- Database memory usage has grown too large. Why?
- The allocator is consuming more memory than expected. Why?
- The allocator has a memory fragmentation issue.
This is a good real sample extracted from System Performance book. There is not limit to go deep into Why?, but, one has to when the software is performing well.
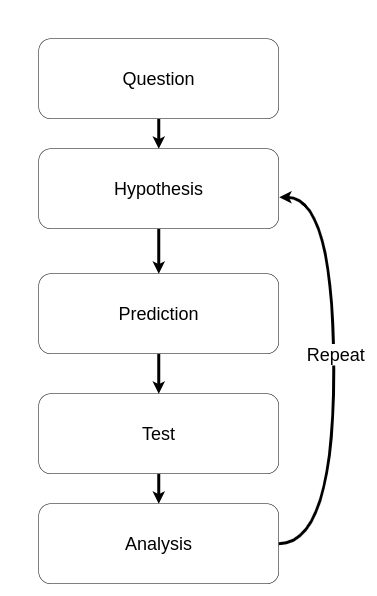
Scientific Method
The scientific method studies the unknown by making hypotheses and testing them. The unknown here can mean the unknown-unknown as discussed in Know-Unknows section.
Every scientific method consists:
- Formulation of a question?
- Hypothesis
- Prediction
- Testing
- Analysis
For more information about how scientific methods, see here
First, define a question based on performance problem; for instance: Why does my application have degraded throughput?.
Second, build a hypothesis about what the cause of poor performance may be. CPU Miss rate? Write a test to prove your theory by for instance using Valgrind.
Collect results from your previous step and analyze how it behaves over time. It will give you a better idea of what components are connected and ultimately affected.
Note: Shaping a hypothesis requires a clear understanding of your software architecture. Versioning your architectural changes can play a key role in understanding sudden changes.
Memory
Usually, when a system boots the memory usage starts to grow as the operating system uses available memory to cache file system improving performance. A system may report that it has only 10 MB of available memory when it actually has 10 GB of file system cache that can be reclaimed by applications immediately when needed.
A common source of confusion is the endless growth of heap. It’s not a memory leak, the free() in most allocators doesn’t return memory to the operating system; rather, it keeps it ready to serve future allocations.
This means the process resident memory will only ever grow, which is normal.
Main memory utilization can be calculated as used memory versus total memory. Memory used by the file system cache can be treated as unused, as it is available for reuse by applications.
CPU
The next figure shows an example CPU architecture, for a single processor with four cores and eight hardware threads in total.
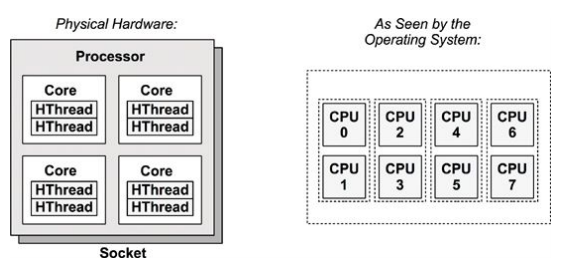
Each hardware thread is addressable as a logical CPU, so this processor appears as eight CPUs. The operating system may have some additional knowledge of topology, such as which CPUs are on the same core, to improve its scheduling decisions.
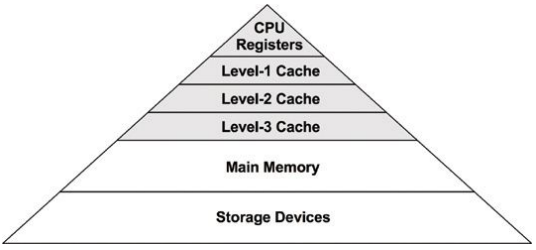
Processors provide various hardware caches for improving memory I/O performance.
High CPU utilization may not necessarily be a problem, but rather a sign that the system is doing work.
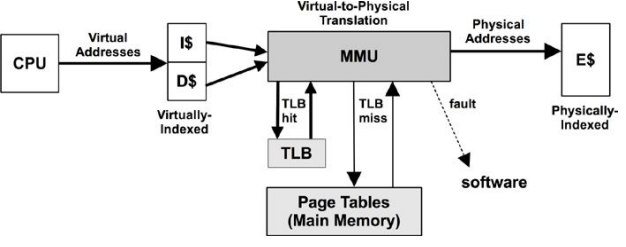
MMU (Memory Management Unit)
The MMU is responsible for virtual-to-physical address translation.
This MMU uses an on-chip TLB to cache address translations. Cache misses are satisfied by translation tables in main memory (DRAM), called page tables, which are read directly by the MMU (hardware).
Tools for CPU analysis
For CPUs, the tools method can involve checking the following:
- uptime: Check load averages to see if CPU load is increasing or decreasing over time. A load average over the number of CPUs in the system usually indicates saturation.
- vmstat: Run vmstat per second, and check the idle column to see how much headroom there is. Less than 10% can be a problem.
- mpstat: Check for individual hot (busy) CPUs, identifying a possible thread scalability problem.
- top/htop: See which processes and users are the top CPU consumers.
- perf: Measure CPI
Performance Issue Example
In the last section, we brought up CPU Cache. Consider the following example:
“An application is performing bad. Monitoring is telling us that has a CPU Intensive workload“
#include <stdlib.h>
#include <stdio.h>
#include <sys/time.h>

#define n 2000

double A[n][n];
double B[n][n];
double C[n][n];

float tdiff(struct timeval* start, struct timeval* end) {
  return (end->tv_sec - start->tv_sec) +
    1e-6 * (end->tv_usec - start->tv_usec);
}

int main(int argc, const char* argv[]) {
  for (int i = 0; i < n; ++i) {
    for (int j = 0; j < n; ++j) {
      A[i][j] = (double)rand() / (double)RAND_MAX;
      B[i][j] = (double)rand() / (double)RAND_MAX;
      C[i][j] = 0;
    }
  }

  struct timeval start, end;

  gettimeofday(&start, NULL);

  for (int i = 0; i < n; ++i) {
    for (int j = 0; j < n; ++j) {
      for (int k = 0; k < n; ++k) {
        C[i][j] += A[i][k] * B[k][j];
      }
    }
  }

  gettimeofday(&end, NULL);
  printf("%0.6f\n", tdiff(&start, &end));
  return 0;
}
The code are spending around of 50 seconds in the server machine. It should be improved by a factor of 10 (following the SLO of application).
The time elapsed varies by machine, of course.
To this performance issue, I would perform the Scientific Method approach:
- Question. Why this application are performing poorly?
- Hypothesis. The ticket shows that application are spending time in CPU intensive operations. The source code tell us that it could has high CPU Cache miss.
- Prediction. Improve the spatial locality through vector access will yield a higher cache hit ratio.
-
Testing. Use
cachegrindorperfto calculate cache hit miss. - Analysis
Each processor reads and writes main memory in contiguos blocks, called cache lines. Although Caches, it has two key terminologies:
-
Cache hit- Accesses to data in cache (fast) -
Cache misses- Accesses to data not in chace - (slow)
The perf is a great tool to perform analysis of cache misses with small overhead:
sudo perf stat -e cache-references,cache-misses ./main.o

52.590355

 Performance counter stats for './main.o':

    11.641.838.626      cache-references
     1.036.364.121      cache-misses              #    8,902 % of all cache refs

      52,674319792 seconds time elapsed

      51,162040000 seconds user
       0,083826000 seconds sys
10% of cache misses is a great point of improvement. This code is performing a bad spatial locality.
The order of for loop matters! Switch the for-j to for-k will improve the cache hit.
  for (int i = 0; i < n; ++i) {
-   for (int j = 0; j < n; ++j) {
+   for (int k = 0; k < n; ++k) {
-     for (int k = 0; k < n; ++k) {
+     for (int j = 0; j < n; ++j) {
        C[i][j] += A[i][k] * B[k][j];
      }
    }
  }
Running the application again, it gets:
sudo perf stat -e cache-references,cache-misses ./main.o

3.184440

 Performance counter stats for './main.o':

     2.572.702.714      cache-references
        46.695.681      cache-misses              #    1,815 % of all cache refs

       3,274432507 seconds time elapsed

       3,157639000 seconds user
       0,040020000 seconds sys
Almost 17x faster!
This is obviously for demonstration purposes only. In real-world issues there are several variables to consider – it is normal when a scientific method doesn’t give an immediate result. Only through different attempts you will increase visibility and improve the application.
Acknowledgement
Thanks to @jbergstroem for reviewing this post.