Node CPU Profiler
How we can measure the performance?
If you are a software engineer, you have already thought about the performance of your Node.js application.
And probably saw the feature flag: --inspect or --inspect-brk to enable CDT(Chrome Dev Tools) and measure performance from there.
Well, that is nice, but sometimes it is not enough. First of all, following the principles of other great engineers, you need to find out what part of your app is the bottleneck: External or Internal.
In this article we are cover Internal improvements.
So, sometimes you don’t have an application to debug or finding the memory leak. Because of that,
I created node-bottleneck is a simple repository
containing versions of a web API each version has an improvement in comparison to the past release.
Feel free to send a PR with an improvement.
All the data analyzed is based on V1 of node-bottleneck.
Specifications:
$ uname -a
Linux name-of-computer 4.15.0-54-generic #58-Ubuntu SMP Mon Jun 24 10:55:24 UTC 2019 x86_64 x86_64 x86_64 GNU/Linux
$ node -v
v12.13.1How slow is it?
We need to find a way to measure your code by doing a load test. At this point, I recommend the following tools:
-
HTTP Application
- /usr/bin/time
- Autocannon - I’ll use it.
- Apache Benchmark
- JMeter
For event-driven applications, I created a tool to only send messages to Kafka: kafka-load-consumer
but you can use anything that can measure the start and end.
So, first of all we need to use autocannon:
npm start &
autocannon -c 10 -d 10 http://localhost:3000/;
that produce the results on my machine:
Running 10s test @ http://localhost:3000
10 connections

┌─────────┬──────┬──────┬───────┬──────┬─────────┬─────────┬──────────┐
│ Stat    │ 2.5% │ 50%  │ 97.5% │ 99%  │ Avg     │ Stdev   │ Max      │
├─────────┼──────┼──────┼───────┼──────┼─────────┼─────────┼──────────┤
│ Latency │ 0 ms │ 0 ms │ 1 ms  │ 1 ms │ 0.07 ms │ 0.27 ms │ 13.25 ms │
└─────────┴──────┴──────┴───────┴──────┴─────────┴─────────┴──────────┘
┌───────────┬─────────┬─────────┬─────────┬─────────┬─────────┬─────────┬─────────┐
│ Stat      │ 1%      │ 2.5%    │ 50%     │ 97.5%   │ Avg     │ Stdev   │ Min     │
├───────────┼─────────┼─────────┼─────────┼─────────┼─────────┼─────────┼─────────┤
│ Req/Sec   │ 12231   │ 12231   │ 13655   │ 13807   │ 13492   │ 420.55  │ 12224   │
├───────────┼─────────┼─────────┼─────────┼─────────┼─────────┼─────────┼─────────┤
│ Bytes/Sec │ 1.53 MB │ 1.53 MB │ 1.71 MB │ 1.73 MB │ 1.69 MB │ 52.6 kB │ 1.53 MB │
└───────────┴─────────┴─────────┴─────────┴─────────┴─────────┴─────────┴─────────┘

Req/Bytes counts sampled once per second.

148k requests in 11.07s, 18.5 MB read
Well, it is a good result, but we need more! For now, we know that our application can serve 148k requests in 11.07 seconds (I know that the results depend over hardware too but it is a beginning)
Where is the slowness at?
Has many ways/tools to measure performance of your app:
-
linux
perf- I’ll use it. - 0x
- clinicjs
- Chrome Dev Tools
perf is a kernel-level CPU profiling tool, it capture the full-stack C++ and JS execution
Let’s check again our app, but now with perf too:
# Start your application
node --perf-basic-prof-only-functions index.js &
[1] 3870
So, our PID is: 3870, let’s start the perf.
$ sudo perf record -F 99 -p 3870 -g -- sleep 20
and start the autocannon (we can start on perf startup too):
autocannon -c 10 -d 10 http://localhost:3000/;
which provides us with the following data from the autocannon:
148k requests in 11.07s, 18.5 MB read
Is it the same as without perf, it has the purpose of producing very little overhead on kernel. For now, we need generate a file with registers:
$ sudo chown root /tmp/perf-3870.map
$ sudo perf script > output-perf
$ cat output-perf

node  3870 27959.178167:          1 cycles:ppp:
            7fffba26f1d8 native_write_msr ([kernel.kallsyms])
            7fffba20e30d __intel_pmu_enable_all.constprop.19 ([kernel.kallsyms])
            7fffba20e350 intel_pmu_enable_all ([kernel.kallsyms])
            7fffba20902c x86_pmu_enable ([kernel.kallsyms])
            7fffba3c1f64 __perf_event_task_sched_in ([kernel.kallsyms])
            7fffba2b9434 finish_task_switch ([kernel.kallsyms])
            7fffbab9e209 __schedule ([kernel.kallsyms])
            7fffbab9e83c schedule ([kernel.kallsyms])
            7fffbaba2dd1 schedule_hrtimeout_range_clock ([kernel.kallsyms])
output-perf
Is not easy to understand the output that perf gives us, so we need to use FlameGraph
git clone --depth 1 http://github.com/brendangregg/FlameGraph
cd FlameGraph/
./stackcollapse-perf.pl < ../node-bottleneck/v1/output-perf | ./flamegraph.pl --colors js > ../node-bottleneck/v1/output-graph.svg
At now, opening your svg:
cd ../node-bottleneck/v1/
google-chrome output-graph.svg

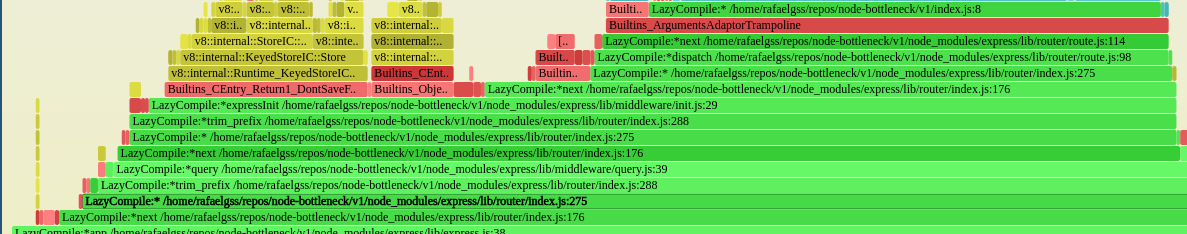
Going deep on the flame we can see the express router taking to longer the CPU use, of course, we need be on mind our endpoint doesn’t process anything
we just care about our http router, in these case express.
Node Profiling Options
--perf-basic-prof-only-functions and --perf-basic-prof seem like the only two you might be initially interested in for debugging your JavaScript code.
These options replace most of functions V8::Function::Call to a real function javascript for you identify in the flamegraph.
This occur because V8 places symbols JIT (Just-in-Time)
This option was introduced here with description:
--perf-basic-prof - outputs the files in a format that the existing perf tool
can consume. Only 'perf report' is supported.
and here has the goal of this flag on NodeJs world.
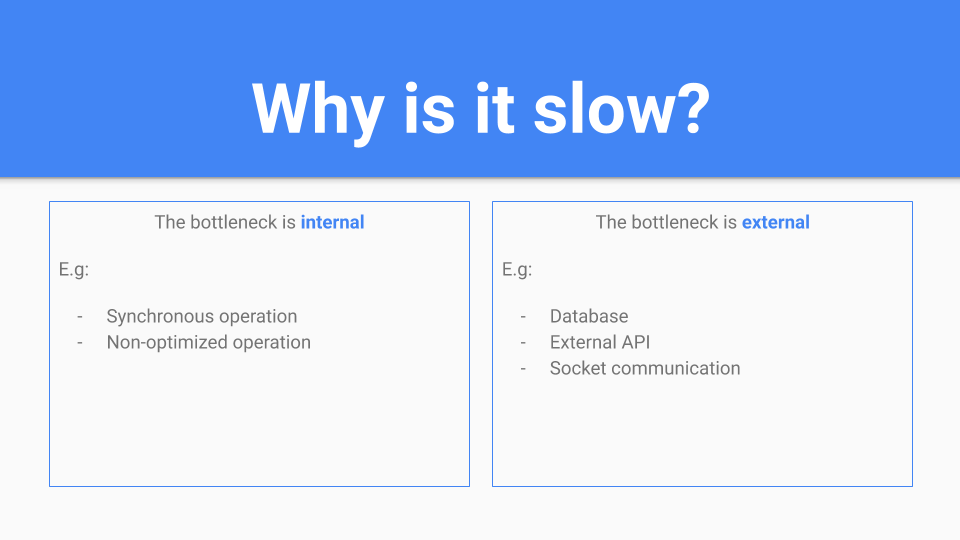
Why is it slow?

Well, based on flamegraph generated previously we can read a simple line as:
- LazyCompile Is an event generated by the V8 compiler, meaning that your function is being compiled and optimized on-demand.
- Asterisk* This is good news meaning that your code was successfully compiled to native code (fast) if you see a tilde (~) that means your code is being interpreted (slow).
- Path & Line This tells file and line.
Based on previous FlameGraph, we can see that most of part of CPU time is around middleware/init.js and router/index.js, of course is expected that express lib must be the most part of CPU time
because our endpoint just returns res.end('ok'). However, the lib is javascript code and could be optimized, we don’t go to deep dive into express source code, but we can change the http router
Tracking Optimizations
We can track hot paths and possible paths to be optimized here too. Just need to run our app with --trace-opt and --trace-deopt flags and analyze output produced by V8.
Take by example in our node-bottleneck v1:
$ npm run start:optand run
$ autocannon -c 10 -d 10 http://localhost:3000/
...
147k requests in 11.08s, 18.4 MB read
$ autocannon -c 10 -d 10 http://localhost:3000/
...
155k requests in 11.07s, 19.4 MB read
$ autocannon -c 10 -d 10 http://localhost:3000/
...
159k requests in 11.07s, 19.9 MB read
I strongly recommend that do you run these commands three times manually and not
for i in {1..3}; do autocannon -c 10 -d 10 http://localhost:3000/; done;because the kernel could not gives you priority on this test and the results could be: TEST 1 > TEST 2 < TEST 3.
and take a look on results produced by autocannon
-
In the first round a lot of functions was optimized and gives us
147k requests in 11.08s, 18.4 MB read -
In the second round less functions was optimized and gives us
155k requests in 11.07s, 19.4 MB read -
In the third round no function has been optimized and give us
159k requests in 11.07s, 19.9 MB read
This results should be different on your computer, but must follow the logical result: TEST 1 < TEST 2 < TEST 3.
Improve!
After our analysis, we discovered that middleware/init.js and router/index.js (functions that use more time of CPU) are from express and we can change it.
I strongly recommend fastify as http router, I wrote a bit about it and you can check here.
So, let’s change:
// package.json
- "express": "^4.17.1",
+ "fastify": "^2.14.1",
// index.js
+ const schema = {
+ schema: {
+ response: {
+ 200: {
+ type: 'string',
+ }
+ }
+ }
+ }
- app.get('/', (req, res) => {
+ app.get('/', schema, (req, res) => {
res.send('ok')
})And now we have the v2.
Running the tests and produce the following results:
$ autocannon -c 10 -d 10 http://localhost:3001/
...
190k requests in 10.09s, 27 MB read
$ autocannon -c 10 -d 10 http://localhost:3001/
...
195k requests in 10.07s, 27.6 MB read
$ autocannon -c 10 -d 10 http://localhost:3001/
...
217k requests in 11.08s, 30.8 MB read
So, the results are so impressive, and thinking about a large scale is a good path to choose from.
And now? – Now you back to the topic How slow is it and repeat all again! Remember, the code always can be optimized.